In this blog post, I will show you the steps on how to enable Microsoft 365 usage analytics. Microsoft 365 usage analytics provides useful Insights about users using Microsoft 365 services and apps. Usage Analytics tracks and analyzes user activities across applications such as Microsoft Word, Excel, PowerPoint, Outlook, Teams, SharePoint, and more.
Contents
M365 Usage Analytics Stats
- Active Users: The number of active users per day, week, or month.
- Activity Reports: Information about user actions, such as file creation, sharing, and collaboration.
- Service Usage: Insights into which users most frequently use Microsoft 365 services and applications.
- Storage Usage: Data on how much storage space is utilized and by whom.
- Collaboration Metrics: Information on collaboration patterns, including how users work together on documents and projects.
- Communication Trends: Statistics on communication activities like emails, messages, and online meetings.
- Device and Platform Metrics: Details on the devices and platforms users employ to access Microsoft 365 services.
Benefits of M365 Usage Analytics
- Optimization: Identifying areas where users may need training or additional support to use Microsoft 365 tools more effectively.
- Resource Allocation: Understanding which applications and services are most critical to users and allocating resources accordingly.
- Security and Compliance: Monitoring usage patterns to ensure compliance with company policies and identify potential security risks.
- User Adoption: Tracking the adoption rate of new features and tools rolled out by Microsoft.
Microsoft 365 Usage Analytics data can be presented through pre-built reports and dashboards within the Microsoft 365 admin center. Admins also have the options to export the reports for further analysis.
Step 1: Enable Microsoft 365 Usage Analytics
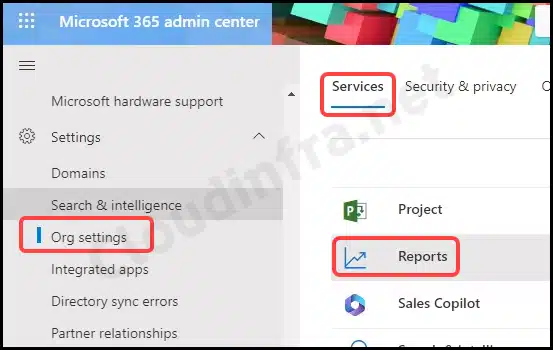
- Sign in to the Microsoft 365 admin center > Settings > Org settings.
- Under the Services tab, click on Reports.
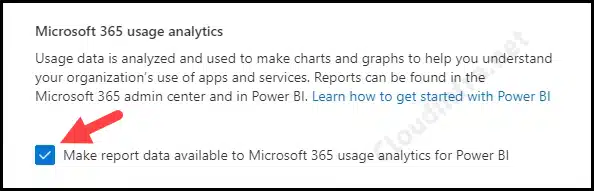
- Enable the checkbox Make report data available to Microsoft 365 usage analytics for PowerBI.
Step 2: Get Microsoft 365 Usage Analytics App on Power BI
- Sign in to the Power BI console as a Global administrator or Report reader or Exchange administrator or Skype for Business administrator or SharePoint administrator.
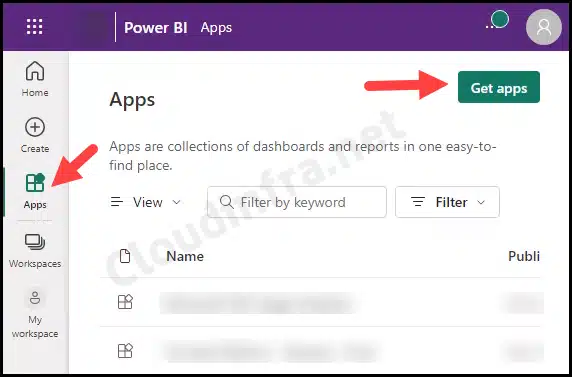
- Once signed in, navigate to the Apps section and click the Get Apps button.
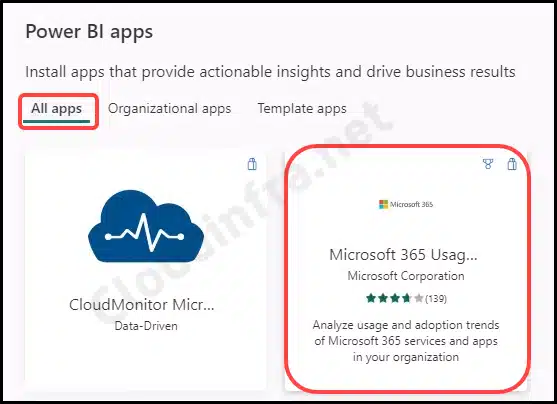
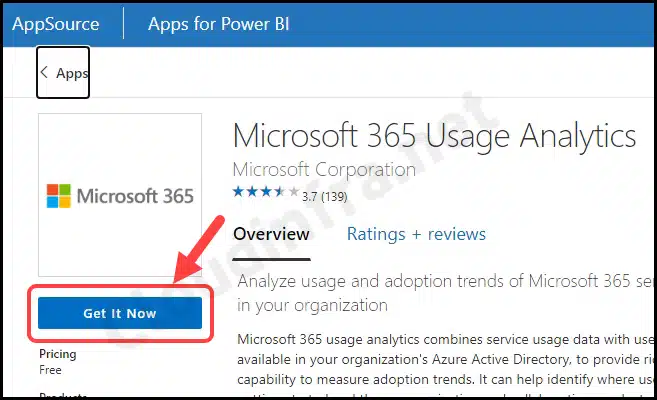
- Search for the Microsoft 365 Usage Analytics app under All Apps. Click on the app.
- Click on the Get It Now button to Get the App.
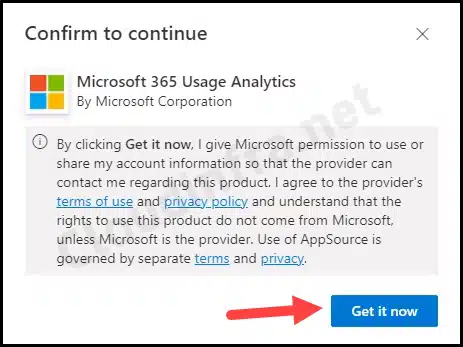
- Click on Get it now button once again to confirm app installation.
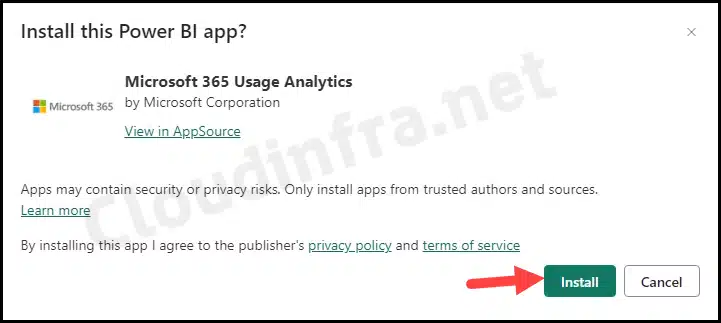
- Click the Install button to Install the Microsoft 365 Usage Analytics Power BI app.
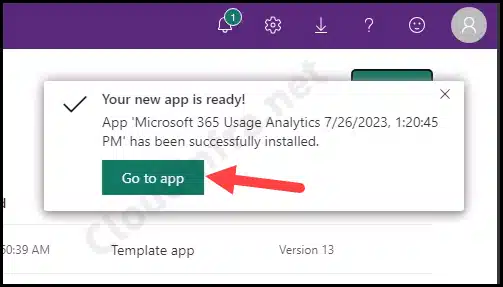
- Once the app is ready, click the Go to app button. If you don’t see this button, you can locate the app under the Apps option on the left-hand side control panel within the Power BI Portal.
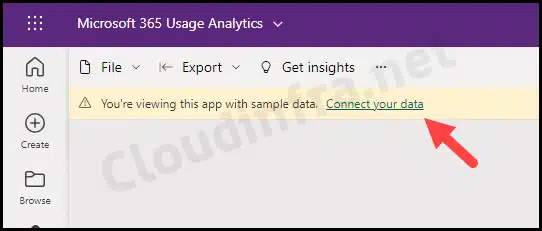
- The app currently has sample data installed. Click on Connect your data to connect it to your tenant and get the Live User and App data report.
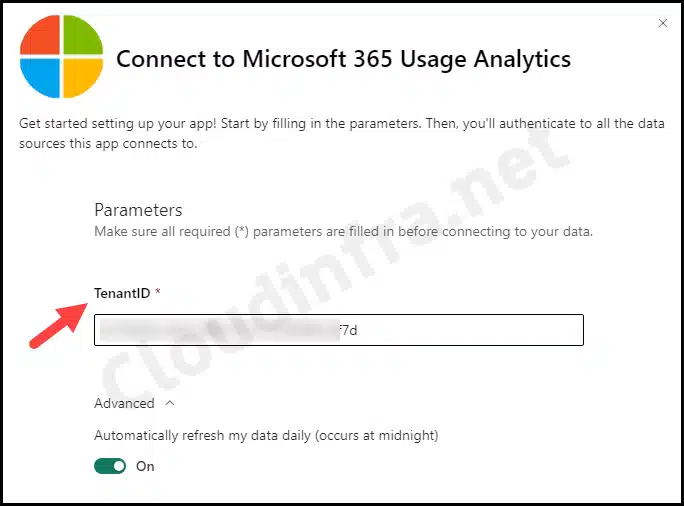
- Provide your Entra ID tenant ID, and under Advanced, keep the default option On for Automatically refresh my data daily (occurs at midnight).
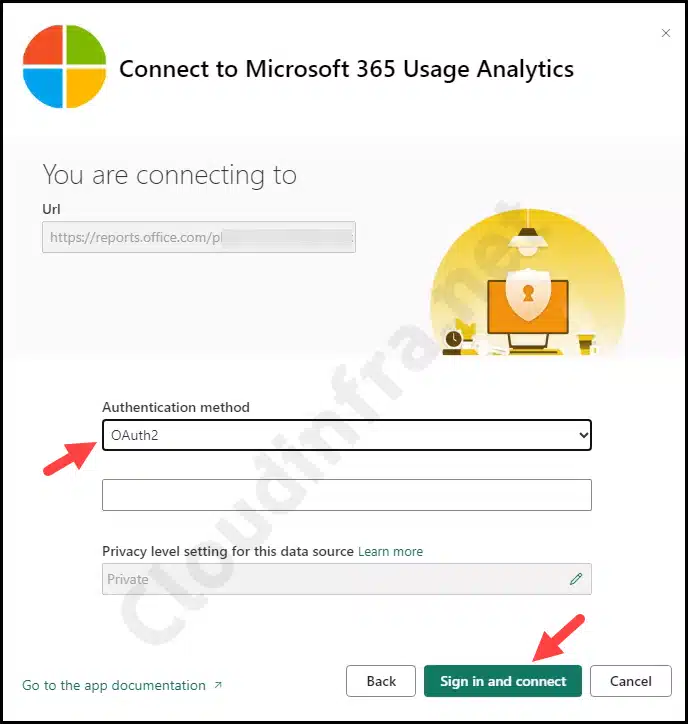
- For Authentication, use OAuth2 and click the Sign in and Connect button. As you are already signed in to the Power BI portal, it will automatically sign in using SSO and connect your app with Entra ID/Microsoft 365.
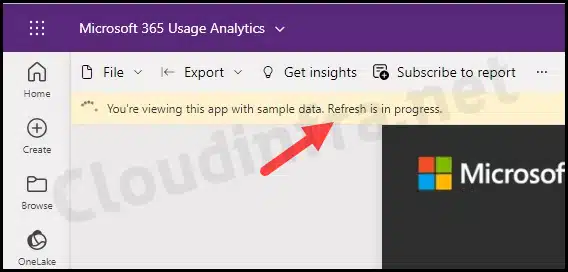
- As you can see, sample data is being replaced with live data. Refresh is in progress.
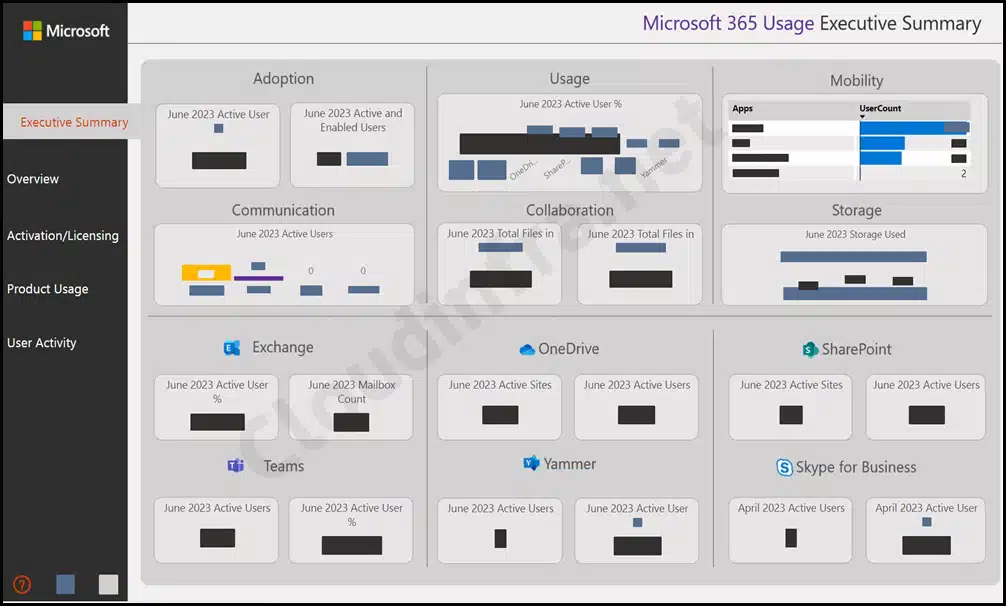
- In just a few minutes, I received a comprehensive report containing data up to the current month. This report includes visual elements like bar charts and graphs and covers various data analysis categories. While I may not cover every category in detail, I’ve provided some key information you can expect to find in the report.
- Executive Summary
- Adoption, Usage, Mobility.
- Communication, Collaboration, Storage.
- Exchange, OneDrive, Sharepoint, Teams, Yammer, and Skype for Business.
- Overview Tab
- Adoption, Usage, Communication, collaboration, Storage and Mobility.
- Provides Overview of data analysis across Exchange, OneDrive, Sharepoint, Teams, Yammer, and Skype for Business.
- Activation/Licensing
- Activation: A bar chart showing Enabled vs. Activated Users and the current month’s Activation percentage, Activated Users, and Total Activation Count.
- Licensed Assigned: Current month Count of License types, Current month Users with Assigned licenses. Assigned licensed over time. Users assigned a subscription.
- Product Usage
- Product Usage Analysis across Exchange, Groups, OneDrive, Sharepoint, Teams, Yammer, and Skype for Business.
- Enabled vs. Active Users graph.
- User Activity
- Top Ten Most Active Departments
- Top Ten Most Active Companies
- User Details across Exchange, OneDrive, Sharepoint, Teams, Yammer, and Skype for Business.
- Department Adoption Information.
Make the Collected data in the report Identifiable/Non-anonymous
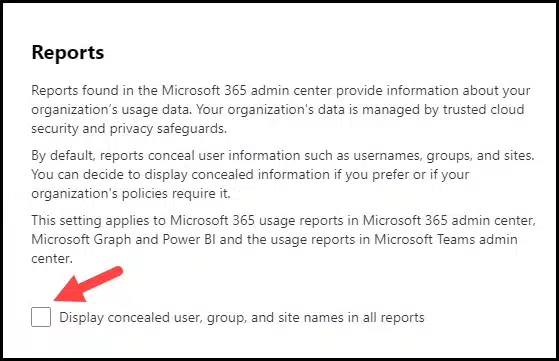
By default, the data collected by Power BI is anonymous, meaning it doesn’t include specific usernames, groups, or site information in the report. However, if you wish to make this data non-anonymous, you can follow the steps below:
- Sign in to the Microsoft 365 admin center > Settings > Org settings.
- Under the Services tab, click on Reports.
- Uncheck Display concealed user, group, and site names in all reports, then save.
Conclusion
In this blog post, we’ve explored the process of enabling Microsoft 365 usage analytics. We’ve accomplished this by installing a Microsoft 365 Usage Analysis app on the Power BI portal under the Apps section. Subsequently, we’ve connected this app to the Entra ID tenant to retrieve and present the latest data in a user-friendly dashboard.